


Introduction: The Overwhelm of Candlestick Patterns
The candlestick chart is one of the most widely used charting tools in technical analysis, offering a visual representation of market sentiment. Investors, traders, and analysts often rely on candlestick patterns to predict short-term price movements, with some of the most popular patterns like the Doji, Hammer, and Engulfing Pattern frequently catching the spotlight. These patterns help traders to gauge market sentiment, potential reversals, and continuation trends, but they can be deceptive at times—especially in volatile markets or during sideways price action.
As the financial markets become more complex, traditional candlestick patterns alone may not always provide the high accuracy or precision traders seek. Hidden within the vast maze of candlestick charts are lesser-known technical indicators that can unlock more effective and higher-probability reversal signals. By integrating these underappreciated indicators into their trading strategy, investors can break through the noise and achieve greater precision in spotting high-probability reversal opportunities.
In this article, we will explore some of these obscure technical indicators that may hold the “key” to successful reversals, discussing their signals, applications, and how they can complement or even outperform traditional candlestick patterns.
I. Understanding the Limitations of Candlestick Patterns
Before we dive into some of the lesser-known indicators that can reveal hidden reversal signals, it’s important to understand why candlestick patterns, while helpful, are not foolproof.
1. Candlestick Patterns and Their Risks
Candlestick patterns are created based on the opening, closing, high, and low prices within a given time period. They are visual tools, and each pattern is associated with a specific market sentiment or potential price movement. However, some of the key risks include:
- False Signals: Not every Doji, Hammer, or Engulfing pattern leads to a reversal. In ranging or choppy markets, these patterns can give false signals.
- Over-Reliance on Patterns: Traders often put too much stock in a single candlestick pattern without considering the broader market context, such as volume, trend strength, or macroeconomic factors.
- Subjectivity: Interpretation of candlestick patterns can vary, with different traders seeing the same setup and drawing different conclusions, leading to inconsistent results.
While candlestick patterns provide helpful visual cues, they do not always capture the complexity of market dynamics, especially when it comes to reversal signals. This is where lesser-known technical indicators can offer a more robust, data-driven approach to finding high-probability reversal points.
II. Lesser-Known Indicators That Can Identify Reversals
In the realm of technical analysis, certain indicators and oscillators are often overshadowed by their more famous counterparts. However, many of these lesser-known tools are capable of spotting trends and reversals with a level of precision that exceeds that of traditional candlestick patterns.
1. The Vortex Indicator (VI)
The Vortex Indicator is a momentum-based technical indicator that can help traders identify potential reversals in trend. It consists of two lines, VI+ (the positive vortex) and VI- (the negative vortex), which measure the difference between the current high/low prices and the previous period’s high/low.
- How It Works: The Vortex Indicator works by measuring the strength of upward and downward price movements. When the VI+ line crosses above the VI- line, it signals the beginning of an uptrend, while a VI- crossing above VI+ suggests a downtrend.
- Why It’s Effective for Reversals: The Vortex Indicator is particularly useful for spotting reversals during choppy or sideways markets, where traditional candlestick patterns may fail. By focusing on the strength of price movements rather than just the pattern of the candlesticks themselves, the Vortex Indicator can pinpoint high-probability reversal points more accurately.
2. The Keltner Channel
The Keltner Channel is a volatility-based indicator that uses the Exponential Moving Average (EMA) and Average True Range (ATR) to define an upper and lower band around the price. The Keltner Channel is similar to Bollinger Bands but uses ATR instead of standard deviation, which some traders believe provides a more precise measure of market volatility.
- How It Works: The upper and lower bands of the Keltner Channel are calculated by adding or subtracting the ATR from the EMA. When the price moves outside these bands, it may indicate overbought or oversold conditions, signaling the potential for a reversal.
- Why It’s Effective for Reversals: The Keltner Channel works well in trending markets and can also highlight volatility squeezes, where price ranges contract before a big move. A price breakout from the channel, especially after a period of consolidation, often signals a high-probability reversal or continuation.
3. The Relative Strength Index (RSI) Divergence
While the Relative Strength Index (RSI) is widely known, its divergence from price movement is a lesser-discussed but powerful signal for spotting reversals. RSI measures the speed and change of price movements on a scale from 0 to 100, with values above 70 indicating overbought conditions and values below 30 indicating oversold conditions.
- How It Works: Traders use RSI divergence to detect when the price is moving in one direction while the RSI is moving in the opposite direction. This discrepancy often indicates weakening momentum and can be an early warning of a trend reversal.
- Why It’s Effective for Reversals: RSI divergence is an excellent tool for detecting price extremes. If the price continues to make higher highs while the RSI forms lower highs (or vice versa), this can signal an imminent reversal, as the underlying momentum starts to fade. It works particularly well when combined with price action patterns such as candlestick formations.
4. The Elder-Ray Index
Developed by Dr. Alexander Elder, the Elder-Ray Index combines both trend-following and momentum indicators to gauge the strength of buyers and sellers in a market. It is comprised of three components: Bull Power, Bear Power, and the Exponential Moving Average (EMA).
- How It Works: The Elder-Ray Index shows whether buyers or sellers are in control of the market. When the Bull Power (difference between the highest price of the bar and the EMA) is greater than the Bear Power (difference between the lowest price of the bar and the EMA), it suggests an uptrend and vice versa.
- Why It’s Effective for Reversals: This indicator is particularly useful for spotting weakening trends and detecting reversal signals. A reversal becomes more likely when the Bull Power starts to decline or Bear Power begins to rise, indicating that the existing trend may be losing steam.
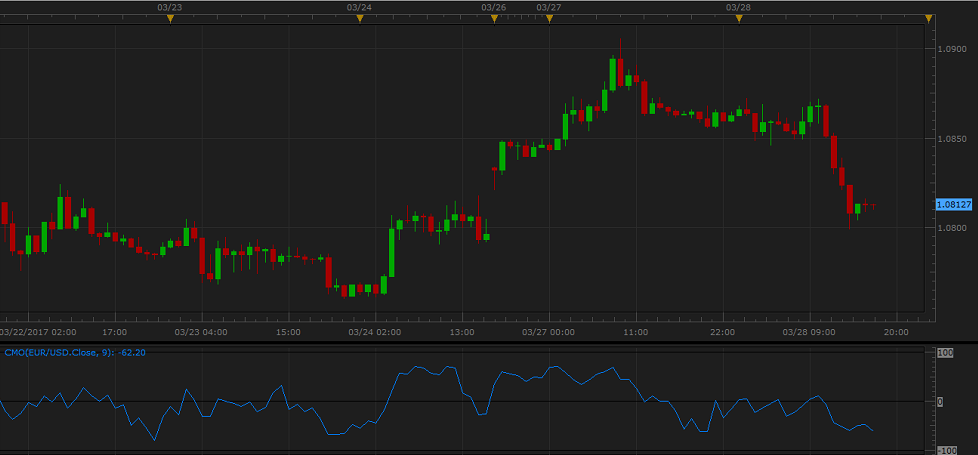
5. The Chande Momentum Oscillator (CMO)
The Chande Momentum Oscillator (CMO) is a momentum oscillator developed by Tushar Chande, which compares the sum of recent gains to recent losses over a specified period. The result is a range-bound oscillator that can be used to identify overbought and oversold conditions.
- How It Works: The CMO oscillates between -100 and +100, with readings above +50 indicating overbought conditions and readings below -50 signaling oversold conditions. A crossing of the zero line can indicate a potential reversal in momentum.
- Why It’s Effective for Reversals: The CMO is more sensitive than other oscillators like the RSI, making it a good tool for early reversal signals. Traders can look for extreme overbought or oversold conditions that are followed by a zero-crossing, signaling a shift in momentum and a potential reversal.
III. Combining Lesser-Known Indicators for High-Probability Reversals
While each of these indicators can be effective on their own, the real power lies in combining them to confirm potential reversal signals. Here’s how you can use them together:
- Confirm RSI Divergence with the Vortex Indicator: If you see RSI divergence signaling a potential reversal, you can confirm the signal by checking if the Vortex Indicator (VI+ and VI-) is crossing over, indicating a shift in momentum.
- Keltner Channel Breakouts with Elder-Ray Index: If the price breaks out of the Keltner Channel after a period of consolidation, you can use the Elder-Ray Index to confirm whether the breakout is supported by strong bullish or bearish momentum.
- Chande Momentum Oscillator + Vortex Indicator: A CMO crossover (from extreme overbought/oversold to zero) can serve as an early signal, which you can validate with the Vortex Indicator for additional confirmation.
By combining these tools, traders can effectively navigate the maze of candlestick patterns and increase their win rate on reversal trades.
IV. Conclusion: The Hidden Code to High Win Rate Reversals
While candlestick patterns have long been a favorite tool for traders, they are not always sufficient on their own to identify high-probability reversals. By incorporating lesser-known technical indicators like the Vortex Indicator, Keltner Channels, RSI Divergence, Elder-Ray Index, and the Chande Momentum Oscillator, traders can significantly enhance their ability to spot and act on reversal signals with a higher degree of confidence.
By using a multi-indicator approach, traders can navigate the complexities of the market with greater precision, increasing their chances of success in identifying profitable reversal opportunities.
In a world where market trends often feel like a maze, unlocking the right set of tools can be the difference between getting lost in the crowd and finding the hidden path to success.


